
We love maps. It’s so much easier to look at a graphic and see how the campaign is going, without having to dig through hundreds or thousands of words (sorry, English majors). In the presidential campaign, the difference is even more important, because US presidential elections are not won by the popular vote. They’re won in the Electoral College, depending on the popular votes in states, and increasingly, in just a handful of states.
In a generic election, a Democrat should win, since a larger number of Americans self-identify as “Democrats.” More importantly, more Americans in the more populated states (California, New York, Illinois) are Democrats. And, as it turns out, more Americans in the “swing states” are also Democrats. However, take a look at this map from Real Clear Politics, one of two premier polling analysis sites.
Deep into the campaign, we are now seeing a lot of “gray” on the map—that is, too close to call. Only five states are solidly “blue” (Democratic)—California, New York, Vermont, Maryland, and Hawaii. Meanwhile, eleven states are deep “red” (Republican)—Idaho, Wyoming, North Dakota, Nebraska, Oklahoma, Arkansas, Kentucky, West Virginia, Tennessee, Alabama, and Alaska.
Many mainly support one party or the other. Some are “leaning” toward one or the other. Then, more than a quarter of the states Real Clear Politics considers “tossup,” including Maine, New Hampshire, Pennsylvania, Ohio, Michigan, Wisconsin, Minnesota, Iowa, North Carolina, Georgia, Florida, Nevada, Arizona, and Colorado. So 170 of the 270 electoral votes are up for grabs.
If you follow the link, you can click on the states to see the lineup, and average, of recent polls for each state.
Meanwhile, the other major analytical site is FiveThirtyEight (538).
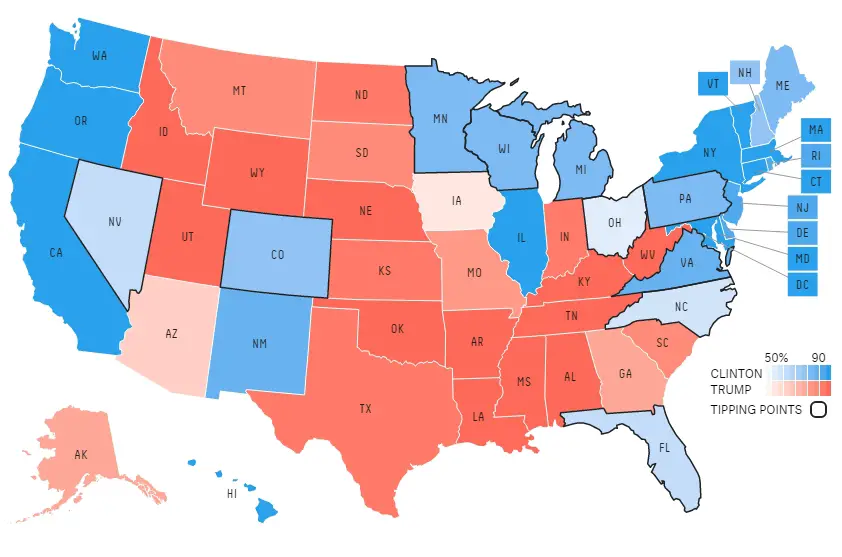
They have their own map. But 538 refuses to have “neutral” (gray) states. It’s still obvious that they consider twelve states as close calls—Minnesota, Wisconsin, Michigan, Ohio, Pennsylvania, New Hampshire, Maine, North Carolina, Florida, Colorado, and Nevada.
Again, if you hover over the state, a pop-up will show you the “chance of winning” of each state. For instance, Hillary now has a 58% likelihood of winning North Carolina.
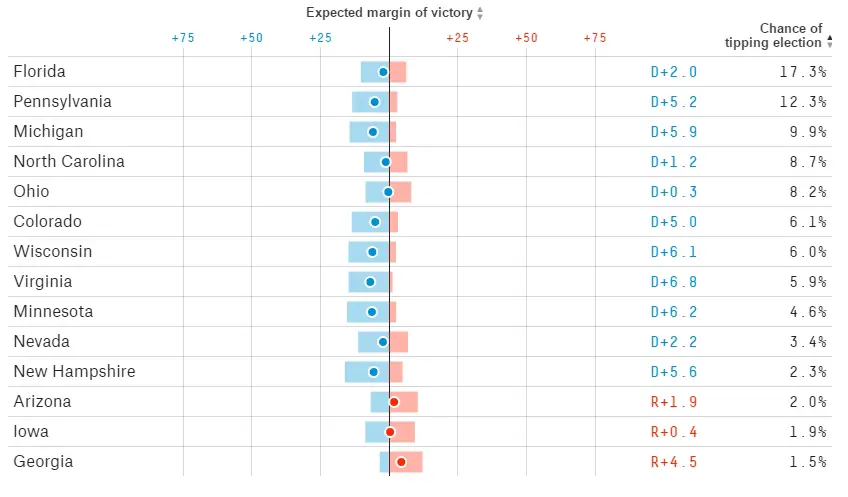
This chart shows how close the close states are, with all of the states right on the black line in the middle, tilting one way or the other.
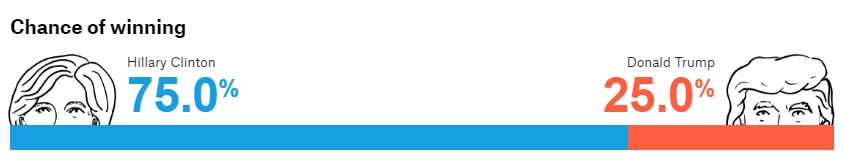
Five Thirty Eight also provides a projected chance of winning the election. At this time, Hillary Clinton is given a 75.0% chance of winning the election.
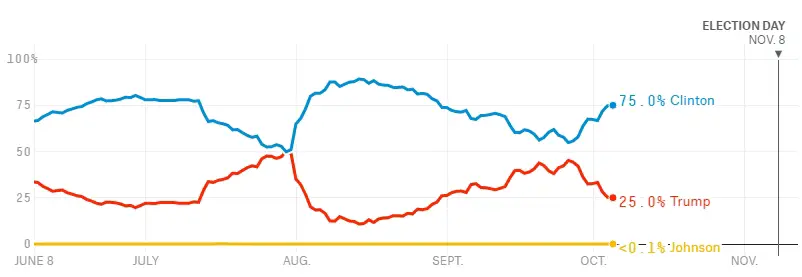
They also have a chart, showing how the odds have changed since June, when Hillary’s chance of winning was the same as it is now. But her chances dropped, until July 30, during the Democratic convention, when Trump took the lead, at 51.1% chance. But the Dem convention went so well that in a little over a week, Hillary’s odds were up to 87.5%. On the day of the first presidential debate (September 26), Trump was up to 45.2%. That debate put Hillary back in the lead—but there are two more presidential debates, and many more domestic and foreign variables.
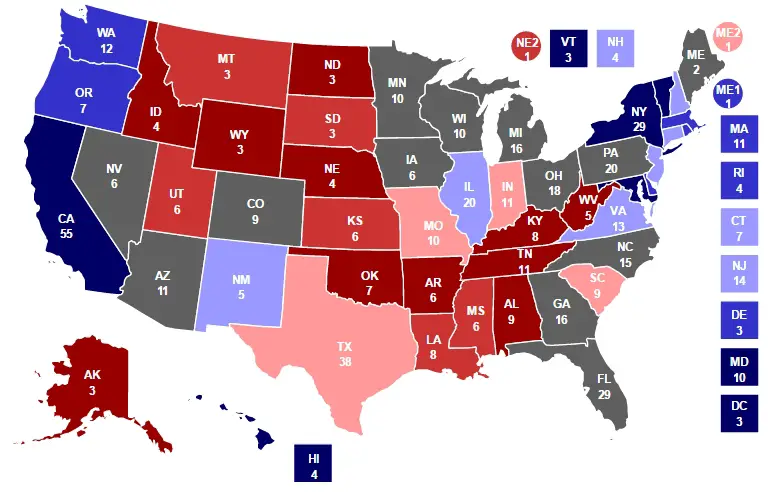
Finally, let’s look at the map provided by John Stossel’s ElectionBettingOdds.com.
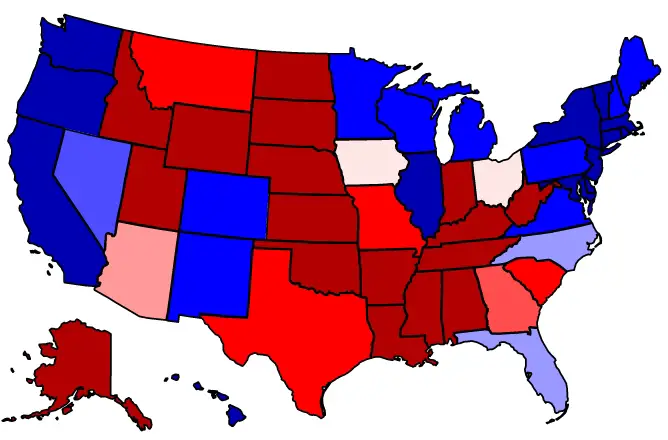
Again, only ten states—California, Oregon, Illinois, New York, Vermont, Massachusetts, Connecticut, Rhode Island, New Jersey, and Maryland are solid for Hillary.
On the other hand, Trump has sixteen states—Idaho, Wyoming, Utah, North Dakota, South Dakota, Nebraska, Kansas, Oklahoma, Arkansas, Louisiana, Mississippi, Alabama, Tennessee, Kentucky, West Virginia, and Alaska.
But despite that, the site gives Hillary Clinton a 73.8% chance of winning the election. As noted before, this site is not based on polls. It’s based on money that individuals from around the world are willing to bet on the outcomes.
The largest surprise of this year’s election is probably that Texas is no longer considered “deep red,” thanks largely to an increase in the Hispanic population.
And, once again, if you hover over states, you’ll see how high the odds are for that state. The most “blue” state is Maryland, giving Hillary a 96.5% chance of winning the state. Wyoming and Alabama, give Trump a 96% chance of winning their states. The biggest tossup is Ohio, with gamblers giving Trump just a 51.5% chance of winning the state.
But the election is not over. Zero Hedge notes that recent Reuters polls have shown a shift from Hillary to Trump.
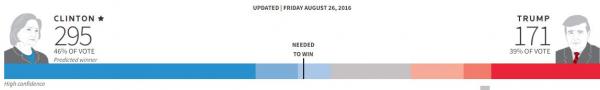
As recently as the end of August, Hillary was given 295 electoral votes, well over the 270 needed to win the election.
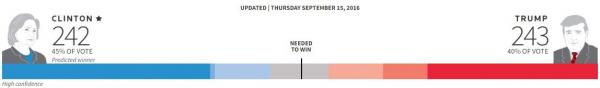
But a more recent Reuters poll shows a dramatic shift in the electoral votes, with Trump now given 243 of the 270 needed—one more than the 242 given to Hillary.
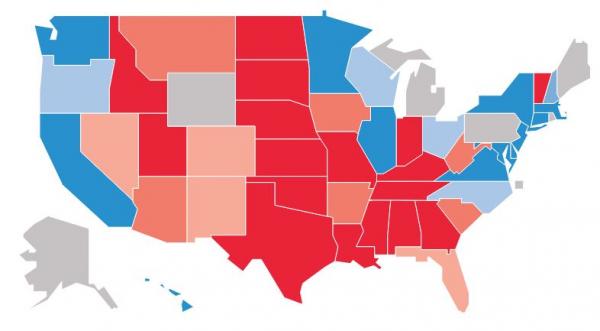
And, as you can see from their map, they have an interesting take on where the states stand. Instead of being solidly for Trump, they show Wyoming and Alaska as tossups. Likewise, Rhode Island is shown as a tossup, instead of solidly being for Hillary. The only other too-close-to-call states are Michigan, Pennsylvania, and Maine. Yet, Zero Hedge is calling the election for Trump at this point.