
We had an article a few weeks ago, with maps predicting the election. We’ll give you an update, and break it into two articles, so we can allow the sites to explain. However, if you want to compare all the maps at once, you can go to 270towin.com. That site gives a very brief explanation of each.
The first map is Sabato’s Crystal Ball—from the University of Virginia.
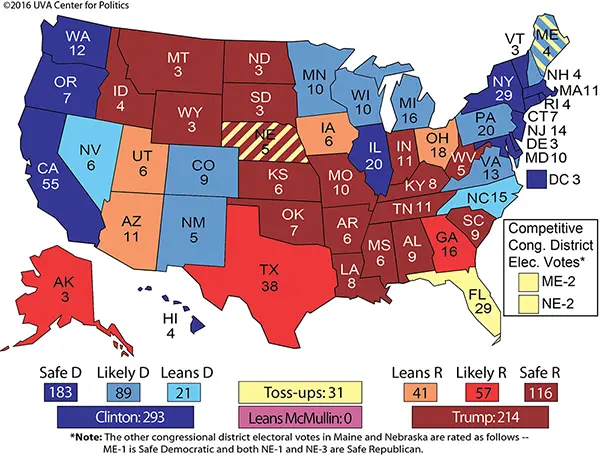
The Crystal Ball calls the election for Hillary at this point, with 293 electoral votes (a candidate only needs 270 to win).
Hillary Clinton has picked an awful time to hit one of the rough patches that has plagued her throughout the campaign. Now with just days to go until Election Day, there’s added uncertainty about the outcome. But while she may not be on the brink of an Electoral College win the size of Barack Obama’s in 2008 or even 2012, her position as the clear frontrunner in this race endures.
Now, granted, some of this is, for her, bad luck and poor timing out of her control: The “Comey Effect,” referring to FBI Director James Comey’s controversial decision to inform Congress of new emails potentially related to the bureau’s investigation of Clinton’s use of a private email server, has put a dent in Clinton in the final stages of the race, although the contest was tightening in some ways before the news.
Then, there’s the Associated Press.
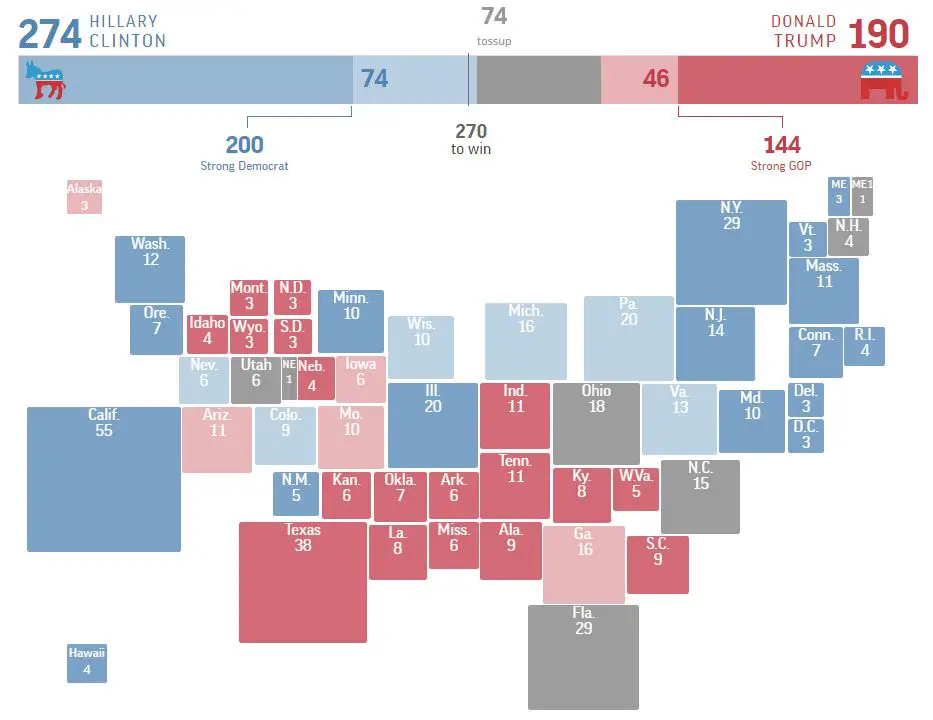
The AP is also calling for Hillary—at this point, with 274 electoral votes. This map shows the states by size of their electoral vote influence. It also gives you a chance to play with the map. If you click a state, you can see what happens if any state is “flipped” to the other candidate.
The surprise in this map is that it gives Hillary the win—without the benefit of Florida, Ohio, North Carolina, New Hampshire, or Maine.
Next, is the Princeton Election Consortium Electoral Map.
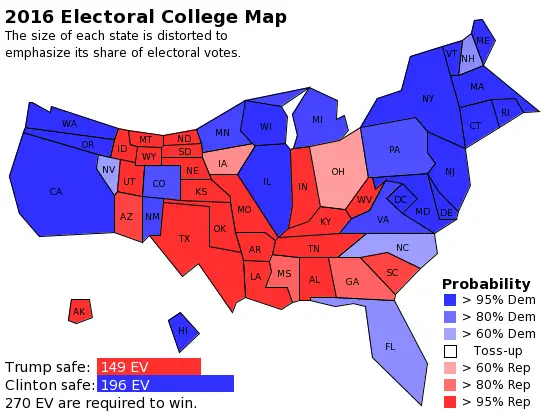
The site also sizes states by their influence, but is a little more fun to look at, since it tries to maintain the shape of the states, while changing their size. Princeton puts Hillary only at 196 safe states, that’s 74 shy of the win. It puts Trump 149, that’s 121 short. But if you look at the map, you’ll see that the map has Florida, North Carolina, New Hampshire, and Nevada all leaning to Hillary. That would give Hillary 312 electoral votes.
Of course, the most quoted site is Nate Silver’s FiveThirtyEight.
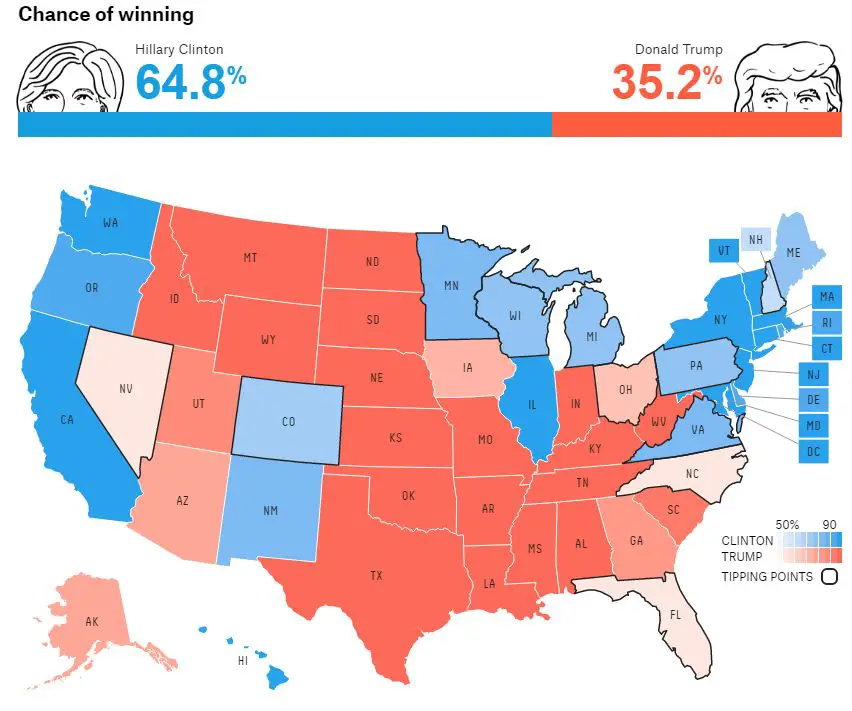
That site gives a forecast—with Hillary winning at 64.8% probability. That sounds strong, but just two weeks ago, Hillary’s chances were 84.6%. Obviously, James Comey’s vague FBI announcement has had a “yuge” impact.
CNN (called “Clinton News Network” by the Trump camp), also has a map.
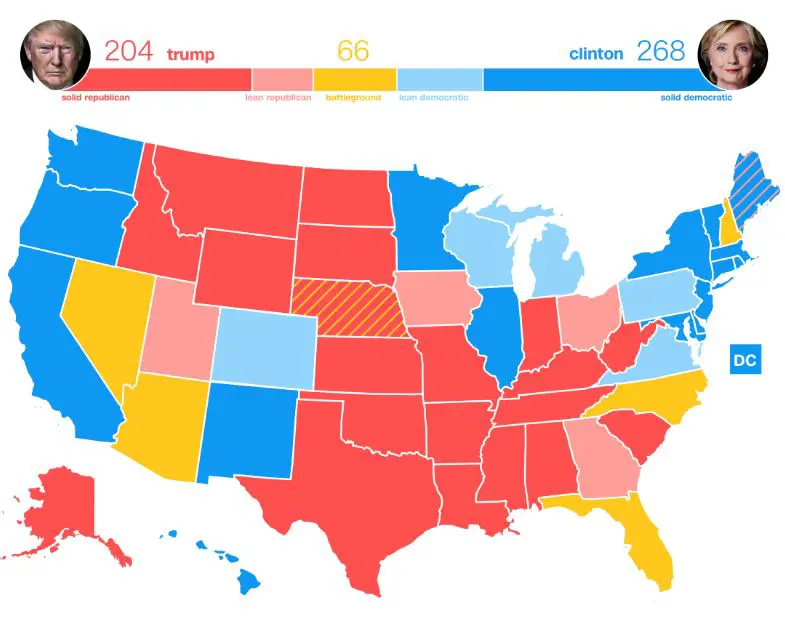
CNN gives Hillary 268 of the 270 she needs. And again, that’s not counting Florida, North Carolina, and New Hampshire.
We’ve made four moves in the map since our last update and all of them are in Donald Trump’s direction. Ohio, Utah, and Maine’s 2nd congressional district are all moving from the battleground/toss-up category to lean Republican. And New Hampshire is moving from lean Democratic to a pure battleground/toss-up state. . .
This is not a prediction of where the map will end up on Tuesday night when the votes are counted, it is simply a snapshot heading into the homestretch.
And finally (on this page), we have Cook Political Report. Their map is not available unless you are a member, but they do have an analysis here.
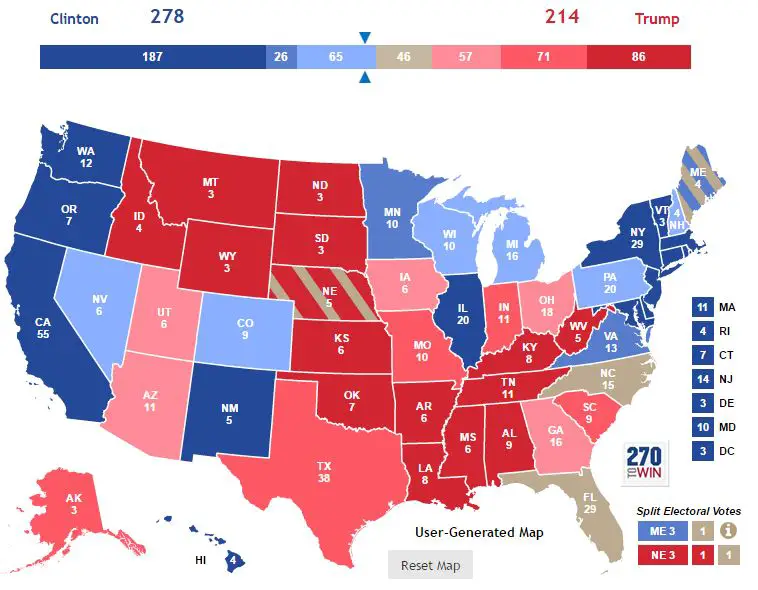
But back to their map, they give Hillary an expected 278 win, again, without Florida or North Carolina.
Trump had the right idea to really shake things up, but he was a flawed vehicle for the change that people desperately wanted. The desire for change is a recurring theme in American politics. In five of the six post-World War II elections when a party had held the White House for eight years, votes chose change, rather than status quo. The lone exception was in 1988, when after eight years of President Reagan, voters chose to stick with Republicans for four more years, under his vice president, George H. W. Bush. Generally, after a party enjoys two terms in the White House, people accumulate deep-seated grievances against that party. Most people, in particular, swing voters, don’t fully trust either party, anyway, and they express their misgivings by turning over the reins to the party that offended them eight years before.
Bit this time, the voters disgruntlement was more pronounced. In the most recent NBC News/Wall Street Journal poll, just 25 percent of Americans thought the country was headed in the right direction, while 65 percent said that they thought it was on the wrong track. This poll has asked this question almost monthly for decades; the last time right direction exceeded wrong track was more than 12 years ago, in January, 2004. The intensity of the alienation enabled Bernie Sanders to put a scare into the Clinton camp, and prompted Republican primary voters to roll the dice on a candidate with no political experience.