
Much ado was made this week about Democrats taking a slight lead in the generic ballot polling averages.
At FiveThirtyEight and RealClearPolitics, Democrats took the lead ever so slightly which caused unnecessary bed-wetting among Republican strategists with short memories.
It’s true, Republicans have basically led the generic ballot polling averages since last year when pollsters started keeping track. Then during the winter months, as inflation jumped and Biden’s Covid vaccine mandates became unpopular, numbers for the GOP were off the charts.
It’s now the summer of 2022 with the midterm election happening in just a few short months. What does it mean that Democrats took a slight edge in August in the generic ballot average?
Historically speaking, not much.
The same trend can be witnessed in 2010 and 2014 to varying degrees. August is the doldrums for political news and polls until things heat up again in September.
The 2010 Red Wave
For example, here’s the 2010 chart from RealClearPolitics which is still available for comparison’s sake.
Note the summer months in June and July of 2010 when Democrats took a slight lead over the GOP:
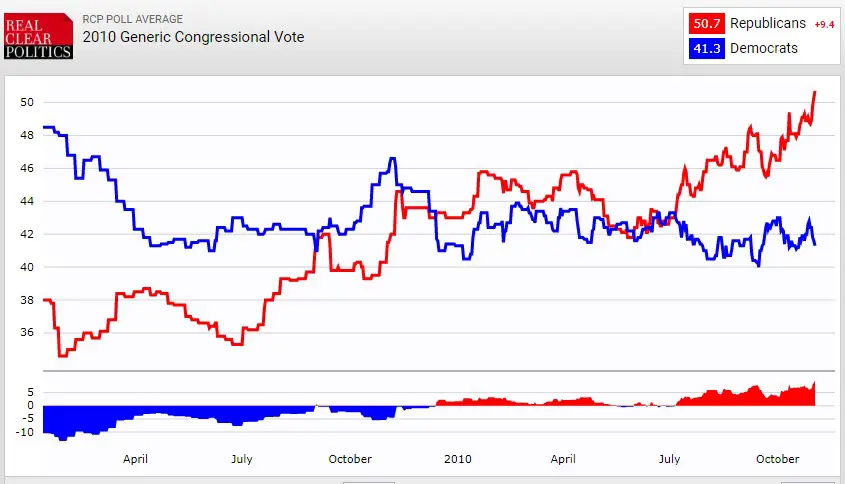
Spot anything around July? That’s when Democrats briefly took the lead and the 2010 bedwetting began in earnest. What if the GOP was overplaying its hand? What if then-President Obama was going to carry his party to victory?
In the end, the RCP average had Republicans winning by 9.4% though the actual result was actually 6.4%, a 3-point overestimate of GOP support. Still not bad for a “shellacking” by Republicans as Obama described it at the time.
The 2014 Red Wave
The 2014 RealClearPolitics generic ballot chart is a different beast altogether and offers a similar view to the charts and numbers we’re seeing today in 2022:
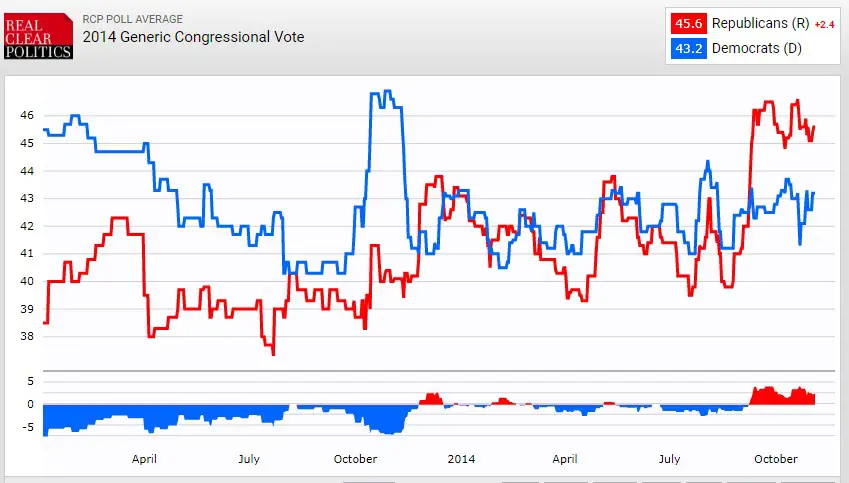 The faux Democratic generic ballot lead in June, July, and August of 2014 broke hard toward Republicans the minute September hit and voters began paying attention again.
In fact, in August of 2014, it looked like Democrats had possibly turned things around and started hoping to reverse their misfortunes of 2010. Not so, in the end.
The final RCP generic ballot average favored Republicans by 2.4% but the true result wound up being a 5.7% victory, a 3-point underestimate of the eventual margin for the GOP.
The 2022 Red Wave?
We don’t know yet what the 2022 wave will look like but with the national environment trending away from Democrats regardless of whatever happened for a week in August, signs point to big Republican victories in November.
Jumping back to the current year, here’s the 2022 RCP generic ballot average to compare against 2010 and 2014:
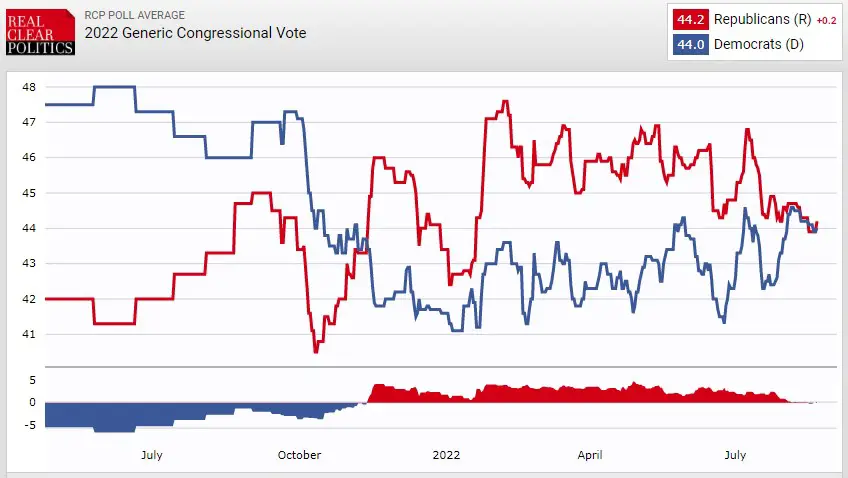 The question looking at this map is deciding where in the 2010 or 2014 cycles we’re currently sitting. Will the 2022 generic ballot over or under estimate support for Republicans in November? We don’t yet know since every cycle brings new issues and new variables for voters to compute.
The abortion issue this year coupled with rampant inflation and Biden’s mishandling of every challenge facing the country will shape the way voters respond in November.
The trend to look for will be the generic ballot polls released during the second and third week of September when more Americans are back from vacations and back to the grind.
Democrats have enjoyed high-fiving during August but September may not be so kind if history is our guide. Republicans are still on track for a historic November victory.